



Python library for computing and visualising mutational spectra — genome-wide profiles of single-nucleotide substitution patterns expressed in 12- or 192-component format (all possible base changes with or without trinucleotide context).
PyMutSpec is the analysis layer used by the NeMu pipeline and has been applied to reconstruct neutral mutation spectra from 2,591 chordate mitochondrial genomes (Iliushchenko et al., bioRxiv 2023).
pip install pymutspecUse tox to test the package in isolated environments across multiple Python versions.
pyenv install 3.8 3.9 3.10 3.11 3.12 3.13 3.14
pyenv local 3.8 3.9 3.10 3.11 3.12 3.13 3.14

pip install tox
tox p
Each tox environment installs the package and runs the test suite with pytest.
If a specific Python interpreter is not installed locally, that environment will be skipped or fail to create. Install missing versions with pyenv (or your system package manager) and re-run tox.
import pandas as pd
from Bio import SeqIO
from pymutspec.annotation import CodonAnnotation, calculate_mutspec
from pymutspec.draw import plot_mutspec12, plot_mutspec192

# 1. Initialise the codon annotator with the desired genetic code
#    (2 = vertebrate mitochondrial; see NCBI for other codes)
coda = CodonAnnotation(gencode=2)

# 2. Load the reference sequence for a single gene
ref_seq = str(next(SeqIO.parse("reference_gene.fasta", "fasta")).seq)

# 3. Compute expected substitution frequencies from the reference
#    Returns dicts keyed by label: 'all', 'syn', 'ff'  (fourfold-degenerate)
sbs12_freqs, sbs192_freqs = coda.collect_exp_mut_freqs(ref_seq, labels=["syn"])
exp_syn_12  = sbs12_freqs["syn"]   # {sbs12: count, ...}  e.g. {"C>A": 215.4, ...}
exp_syn_192 = sbs192_freqs["syn"]  # {sbs192: count, ...} e.g. {"A[C>A]A": 8.2, ...}

# 4. Load observed mutations (from NeMu-pipeline output or your own table)
obs = pd.read_csv("observed_mutations.tsv", sep="\t")

# Filter to synonymous mutations only (Label == 1 or 2)
obs_syn = obs[obs["Label"] >= 1]

# 5. Calculate spectra
ms12  = calculate_mutspec(obs_syn, exp_syn_12,  use_context=False)
ms192 = calculate_mutspec(obs_syn, exp_syn_192, use_context=True)

# 6. Plot
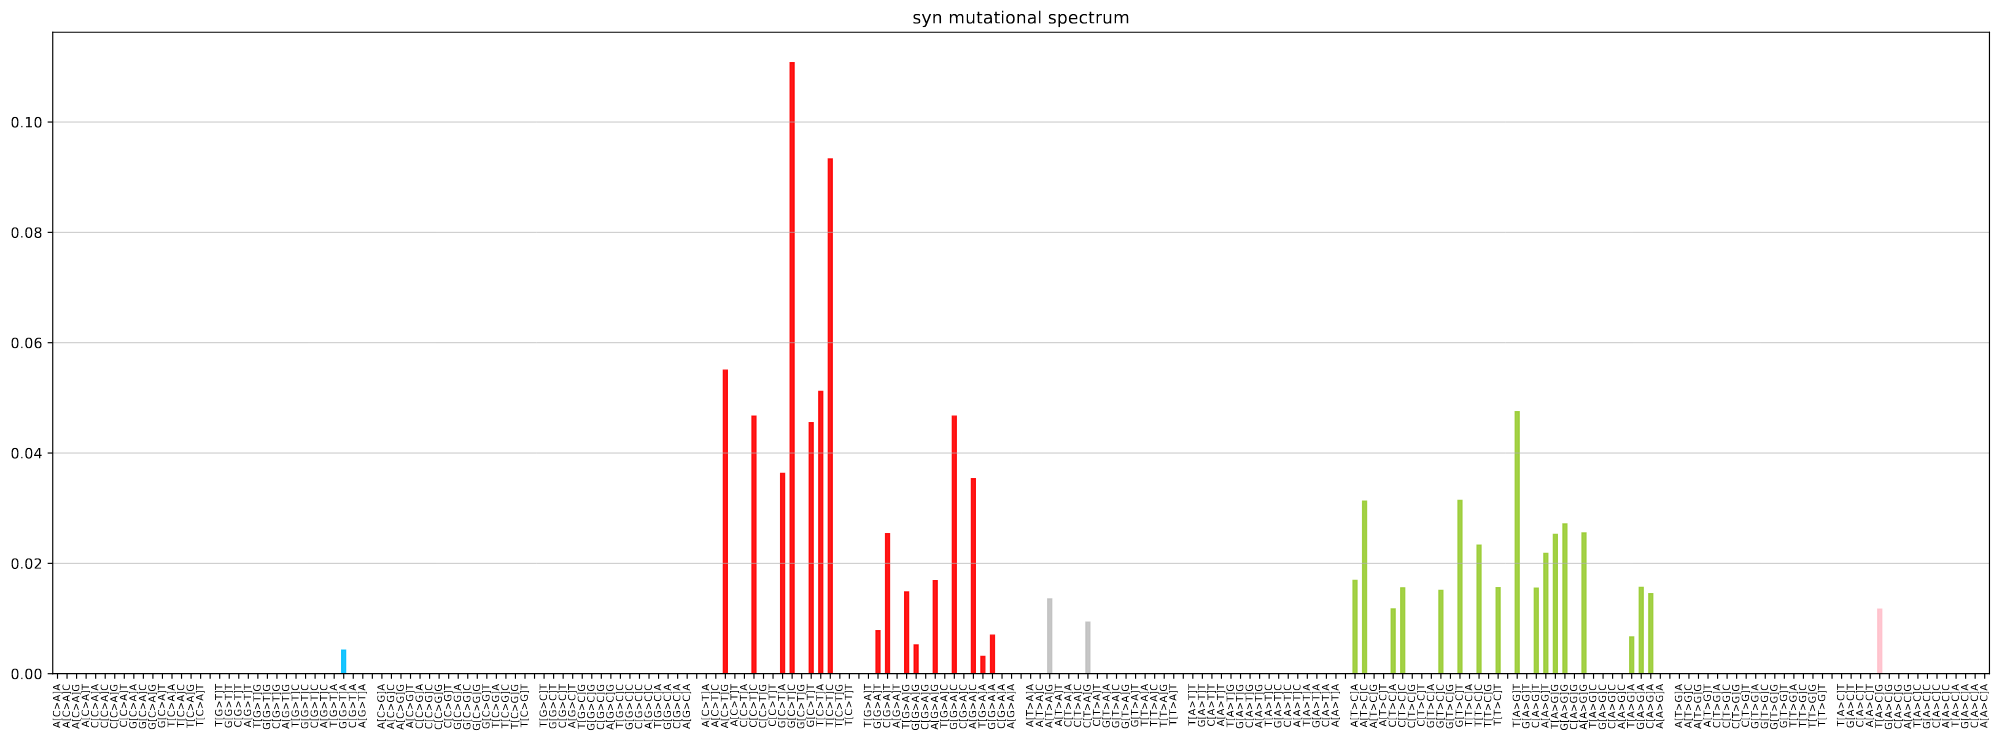
plot_mutspec12(ms12,   title="12-component spectrum")
plot_mutspec192(ms192, title="192-component spectrum")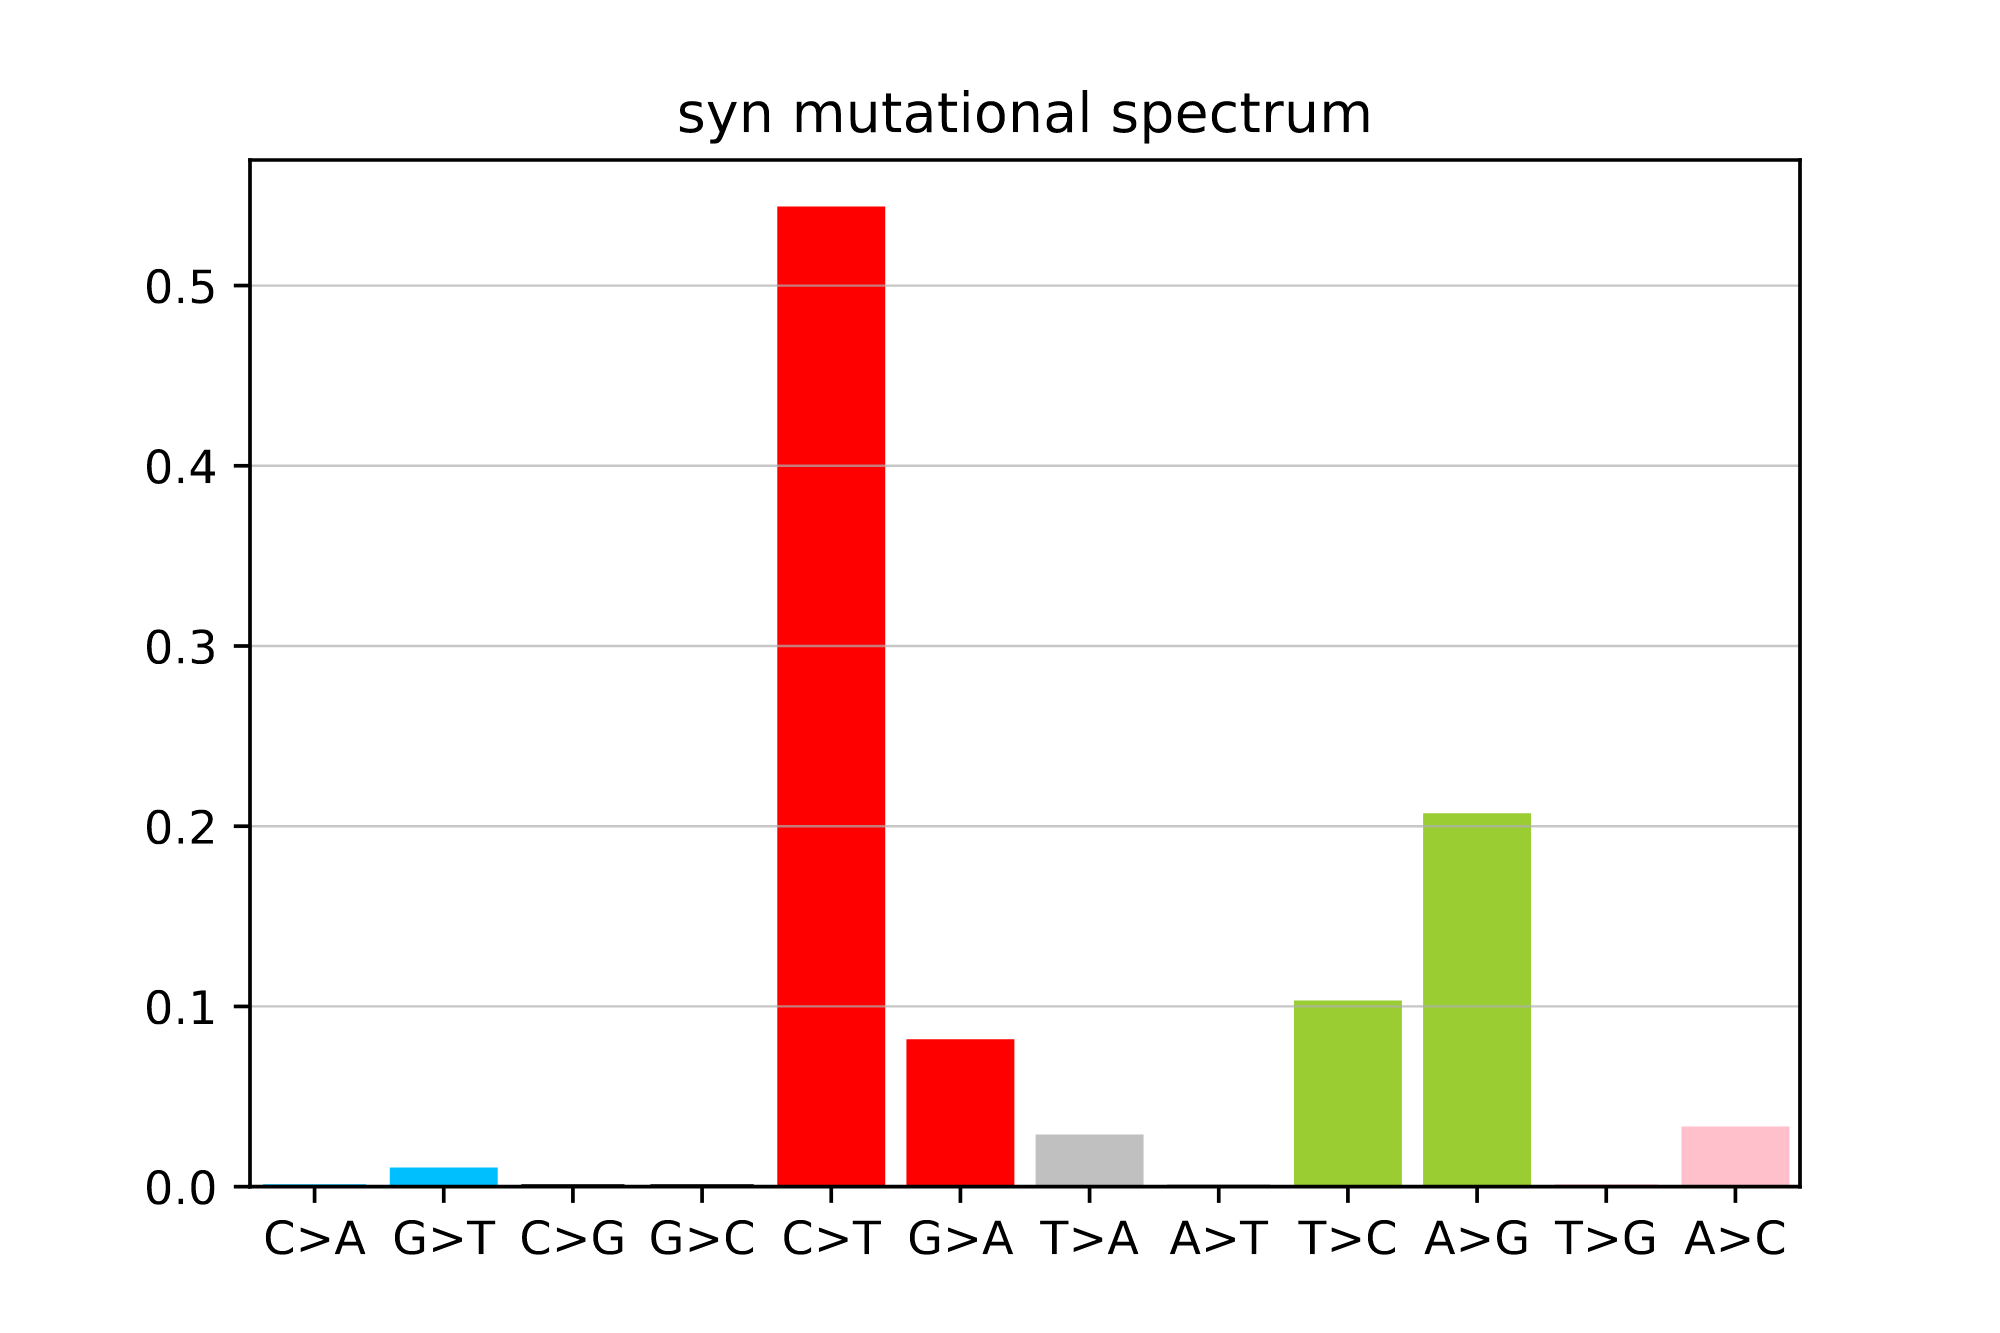
CodonAnnotation is the central class for working with codon-level mutation annotation.
It wraps a NCBI genetic code table and pre-computes synonymous and fourfold-degenerate codon
sets for fast lookup.
from pymutspec.annotation import CodonAnnotation

# Standard genetic code (1)
coda_standard  = CodonAnnotation(gencode=1)

# Vertebrate mitochondrial code (2) — used for mtDNA analyses
coda_mito_vert = CodonAnnotation(gencode=2)

# Inspect available methods
coda = CodonAnnotation(gencode=2)

# Translate a codon
coda.translate_codon("ATG")   # → 'M'

# Check whether a mutation is synonymous
coda.is_syn_mut("CTA", "CTG") # → True   (Leu → Leu)
coda.is_syn_mut("ATG", "ACG") # → False  (Met → Thr)

# Check whether a codon is fourfold-degenerate at the 3rd position
coda.is_fourfold("GTC")  # → True  (Val, all third-position changes are synonymous)
coda.is_fourfold("ATG")  # → False

# Get mutation type label for a given codon pair and position-in-codon
label, aa_ref, aa_alt = coda.get_mut_type("CTA", "CTG", pic=2)
# label: 1 (syn), 2 (syn fourfold), 0 (non-syn), -1 (stop gain), ...
Available NCBI genetic codes:
| Code | Description |
|---|---|
| 1 | Standard |
| 2 | Vertebrate mitochondrial |
| 4 | Mold, Protozoan, and Coelenterate mt |
| 5 | Invertebrate mitochondrial |
| 9 | Echinoderm and Flatworm mt |
| 13 | Ascidian mitochondrial |
Expected mutation frequencies capture how many opportunities each mutation type has in a given sequence, accounting for codon structure and the requested synonymy class.
from pymutspec.annotation import CodonAnnotation

coda = CodonAnnotation(gencode=2)

# From a single nucleotide sequence string (coding sequence, multiple of 3)
seq = "ATGCTAGTCGCATGA"  # example coding sequence
sbs12_freqs, sbs192_freqs = coda.collect_exp_mut_freqs(seq, labels=["all", "syn", "ff"])

# sbs12_freqs["syn"]  → dict mapping 12-component SBS to expected counts
# sbs192_freqs["syn"] → dict mapping 192-component SBS to expected counts

# For a whole-genome / multi-gene analysis (e.g. from MSA or NeMu output),
# compute expected frequencies for each sequence in the alignment and average:
from Bio import SeqIO
sequences = [str(r.seq) for r in SeqIO.parse("msa_nuc.fasta", "fasta")
             if r.id != "OUTGRP"]

exp12_all, exp192_all = [], []
for seq in sequences:
    e12, e192 = coda.collect_exp_mut_freqs(seq, labels=["syn"])
    exp12_all.append(e12["syn"])
    exp192_all.append(e192["syn"])

# Average expected counts across sequences
import pandas as pd
exp12_mean  = pd.DataFrame(exp12_all).mean().to_dict()
exp192_mean = pd.DataFrame(exp192_all).mean().to_dict()
The labels parameter controls which mutation classes are included:
| Label | Meaning |
|---|---|
"all" |
All single-nucleotide substitutions |
"syn" |
Synonymous substitutions only |
"ff" |
Fourfold-degenerate (most neutral) synonymous sites |
PyMutSpec works with observed-mutations tables produced by the NeMu pipeline or tables you construct yourself. The minimum required columns are:
| Column | Type | Description |
|---|---|---|
Mut |
str | Mutation string in 192-component format: X[N>M]Y where X,Y are flanking nucleotides and N>M is the substitution, e.g. A[C>T]G |
Label |
int | Mutation type: 0 non-syn, 1 syn, 2 fourfold syn |
Additional columns produced by NeMu and used by advanced functions:
| Column | Description |
|---|---|
ProbaFull |
Probability weight of the mutation (from ancestral reconstruction) |
RefNode / AltNode |
Parent and child node names in the phylogeny |
Site |
Position in gene (1-based) |
PosInCodon |
Position in codon (1-based: 1, 2, or 3) |
RefCodon / AltCodon |
Reference and mutated codons |
RefAa / AltAa |
Reference and mutated amino acids |
import pandas as pd

obs = pd.read_csv("observed_mutations.tsv", sep="\t")
print(obs[["Mut", "Label", "ProbaFull"]].head())
#            Mut  Label  ProbaFull
# 0  A[C>T]G      1     0.91
# 1  T[G>A]C      0     0.85
# 2 C[A>G]T 2 0.78calculate_mutspec divides observed counts by expected frequencies to produce a normalised
spectrum vector.
from pymutspec.annotation import calculate_mutspec

# --- 12-component spectrum ---
ms12 = calculate_mutspec(
    obs_muts=obs_syn,        # DataFrame with at least "Mut" column
    exp_muts=exp12_mean,     # dict {sbs12: expected_count}
    use_context=False,       # False → 12-component
    use_proba=False,         # True → weight mutations by ProbaFull column
    scale=True,              # Normalise to sum to 1
)
# ms12 columns: Mut, ObsNum, ExpNum, MutSpec

# --- 192-component spectrum ---
ms192 = calculate_mutspec(
    obs_muts=obs_syn,
    exp_muts=exp192_mean,    # dict {sbs192: expected_count}
    use_context=True,        # True → 192-component
    use_proba=True,          # Use ancestral-reconstruction probabilities
    scale=True,
)
When using NeMu-pipeline output with probability weights, set use_proba=True and make sure
the ProbaFull column is present.
The Label column codes for mutation types:
| Value | Meaning |
|---|---|
0 |
Non-synonymous |
1 |
Synonymous |
2 |
Fourfold-degenerate synonymous |
-1 |
Stop gain |
-2 |
Stop loss |
-3 |
Stop-to-stop |
Filter to the mutation class you need before calling calculate_mutspec:
# Synonymous only (Label == 1 or 2)
obs_syn = obs[obs["Label"] >= 1]

# Fourfold-degenerate synonymous only
obs_ff = obs[obs["Label"] == 2]

# All mutations
obs_all = obs.copy()from pymutspec.draw import plot_mutspec12, plot_mutspec192
# 12-component barplot
plot_mutspec12(ms12, title="Human CytB – synonymous spectrum", ylabel="MutSpec")
# 192-component barplot (COSMIC order, default)
plot_mutspec192(ms192, title="192-component spectrum")
# 192-component barplot with KK-style compact labels
from pymutspec.draw.spectra import ordered_sbs192_kk
plot_mutspec192(ms192, sbs_order=ordered_sbs192_kk, labels_style="kk",
title="192-component spectrum (KK order)")
# Save to file without displaying
plot_mutspec192(ms192, savepath="spectrum.png", show=False)
# Draw on an existing axes (useful for multi-panel figures)
import matplotlib.pyplot as plt
fig, (ax1, ax2) = plt.subplots(1, 2, figsize=(14, 4))
plot_mutspec12(ms12, ax=ax1, show=False, title="12-comp")
plot_mutspec12(ms12_2, ax=ax2, show=False, title="Other sample")
plt.tight_layout()
plt.show()labels_style options for 192-component plots:
| Value | Tick label format | Example |
|---|---|---|
"cosmic" |
Full COSMIC string | A[C>A]T |
"long" |
Same as "cosmic" |
A[C>A]T |
"kk" |
Compact KK format | CA: ACT |
When you want to aggregate per-branch or per-sample 192-component spectra into a single matrix and then reduce to 12 components:
from pymutspec.annotation import complete_sbs192_columns
from pymutspec.annotation.spectra import collapse_sbs192
from pymutspec.constants import possible_sbs192

# Suppose you have a list of per-sample spectra as dicts
samples = [
    {"A[C>A]A": 0.012, "T[G>T]T": 0.008, ...},  # sample 1
    {"A[C>A]A": 0.009, "C[C>T]G": 0.021, ...},  # sample 2
]
df192 = pd.DataFrame(samples)

# Ensure all 192 columns are present (fill missing with 0)
df192 = complete_sbs192_columns(df192)  # shape: (n_samples, 192)

# Collapse to 12 components
df12 = collapse_sbs192(df192, to=12) # shape: (n_samples, 12)jackknife_spectra_sampling estimates spectrum variability by repeatedly sampling a fraction
of branches (tree edges) without replacement:
from pymutspec.annotation.spectra import jackknife_spectra_sampling

# obs: observed mutations DataFrame (long format with RefNode, AltNode, Mut, ProbaFull)
# exp: expected frequencies DataFrame (long format with Node, Mut, Proba)
spectra_samples = jackknife_spectra_sampling(obs, exp, frac=0.5, n=1000)
# spectra_samples: DataFrame of shape (1000, 192)

# Derive confidence intervals
q05  = spectra_samples.quantile(0.05)
q95  = spectra_samples.quantile(0.95)
median = spectra_samples.median()

# Build a summary table for plotting with error bars
import pandas as pd
summary = pd.DataFrame({
    "Mut":           possible_sbs192,
    "MutSpec":       ms192.set_index("Mut")["MutSpec"],
    "MutSpec_median": median.values,
    "MutSpec_q05":   q05.values,
    "MutSpec_q95":   q95.values,
})
# plot_mutspec192 will automatically draw error bars if those columns are present
plot_mutspec192(summary, title="Spectrum with 90% CI")For phylogenomic analyses it is useful to compute a separate mutational spectrum for each branch of the phylogeny, then compare them:
from pymutspec.annotation.spectra import calc_edgewise_spectra, get_cossim

spectra_per_edge = calc_edgewise_spectra(
    obs,                   # observed mutations with RefNode/AltNode columns
    exp,                   # expected frequencies with Node column
    nmtypes_cutoff=10,     # minimum distinct mutation types per branch
    nobs_cuttof=10,        # minimum observed mutations per branch
    scale=True,            # normalise each branch spectrum
)
# spectra_per_edge: DataFrame indexed by (RefNode, AltNode), 192 columns

# Compare two sets of branch spectra using cosine similarity
cossim = get_cossim(spectra_per_edge.loc[["nodeA"]], spectra_per_edge.loc[["nodeB"]])| Function / Class | Description |
|---|---|
CodonAnnotation(gencode) |
Codon-level annotator for a given NCBI genetic code |
CodonAnnotation.collect_exp_mut_freqs(seq, labels) |
Expected substitution counts from a nucleotide sequence |
CodonAnnotation.collect_exp_muts(seq, labels) |
Expected substitutions as a long-format DataFrame |
CodonAnnotation.is_syn_mut(cdn1, cdn2) |
Test if a codon change is synonymous |
CodonAnnotation.is_fourfold(cdn) |
Test if a codon is fourfold-degenerate |
CodonAnnotation.translate_codon(cdn) |
Translate a codon to a single-letter amino acid |
CodonAnnotation.get_mut_type(cdn1, cdn2, pic) |
Return mutation type label, ref AA, alt AA |
calculate_mutspec(obs, exp, ...) |
Compute a 12- or 192-component mutational spectrum |
complete_sbs192_columns(df) |
Ensure a DataFrame has all 192 SBS columns (fill missing with 0) |
mutations_summary(mutations, ...) |
Tabulate mutation type counts from an observed-mutations table |
rev_comp(sbs) |
Reverse-complement a 192-component SBS string, e.g. A[C>A]T → A[G>T]T |
lbl2lbl_id(lbl) / lbl_id2lbl(id) |
Convert between label string and integer code |
| Function | Description |
|---|---|
collapse_sbs192(df, to=12) |
Sum 192-component spectra to 12 components |
collapse_mutspec(ms192) |
Collapse a 192-row spectrum DataFrame to 96 components via strand symmetry |
filter_outlier_branches(obs_df, ...) |
Remove branches with outlier-high mutation counts (IQR method) |
jackknife_spectra_sampling(obs, exp, frac, n) |
Bootstrap spectrum confidence intervals by branch resampling |
calc_edgewise_spectra(obs, exp, ...) |
Per-branch (edge-wise) mutational spectra |
get_cossim(a, b) |
Row-wise cosine similarity between two spectrum DataFrames |
get_eucdist(a, b) |
Row-wise Euclidean distance between two spectrum DataFrames |
| Function | Description |
|---|---|
plot_mutspec(mutspec, sbs_kind, ...) |
Generic plotting function (12- or 192-component) |
plot_mutspec12(mutspec, ...) |
Convenience wrapper for 12-component barplots |
plot_mutspec192(mutspec, ...) |
Convenience wrapper for 192-component barplots |
- NeMu pipeline — end-to-end pipeline for neutral mutation spectra from evolutionary data
- IQ-Tree2 — efficient software for phylogenomic inference
- Genetic codes — NCBI codon tables
- mtDNA chordata analysis — example notebooks using PyMutSpec on 2,591 vertebrate mitochondrial genomes
If you use PyMutSpec in your work, please cite the paper that describes the methods:
Efimenko, B., Popadin, K., & Gunbin, K. (2024). NeMu: a comprehensive pipeline for accurate reconstruction of neutral mutation spectra from evolutionary data. Nucleic Acids Research, 52(W1), W108–W115. https://doi.org/10.1093/nar/gkae438
Suggested BibTeX entry:
@article{Efimenko2024NeMu,
    author  = {Efimenko, Bogdan and Popadin, Konstantin and Gunbin, Konstantin},
    title   = {NeMu: a comprehensive pipeline for accurate reconstruction of neutral mutation spectra from evolutionary data},
    journal = {Nucleic Acids Research},
    volume  = {52},
    number  = {W1},
    pages   = {W108--W115},
    year    = {2024},
    doi     = {10.1093/nar/gkae438},
}
Thank you for citing the work if PyMutSpec aids your research.
- Custom tree implementation
- New way of annotation from HGT
- Separate scripts for mutations collection and annotation
- Integrate parallelisation from HGT project
- Add feature to calculate mutation rate (MutRate)
- Rename some functions and variables for better readability