



A modular CubeSat subsystem emulation and hardware-in-the-loop test framework.
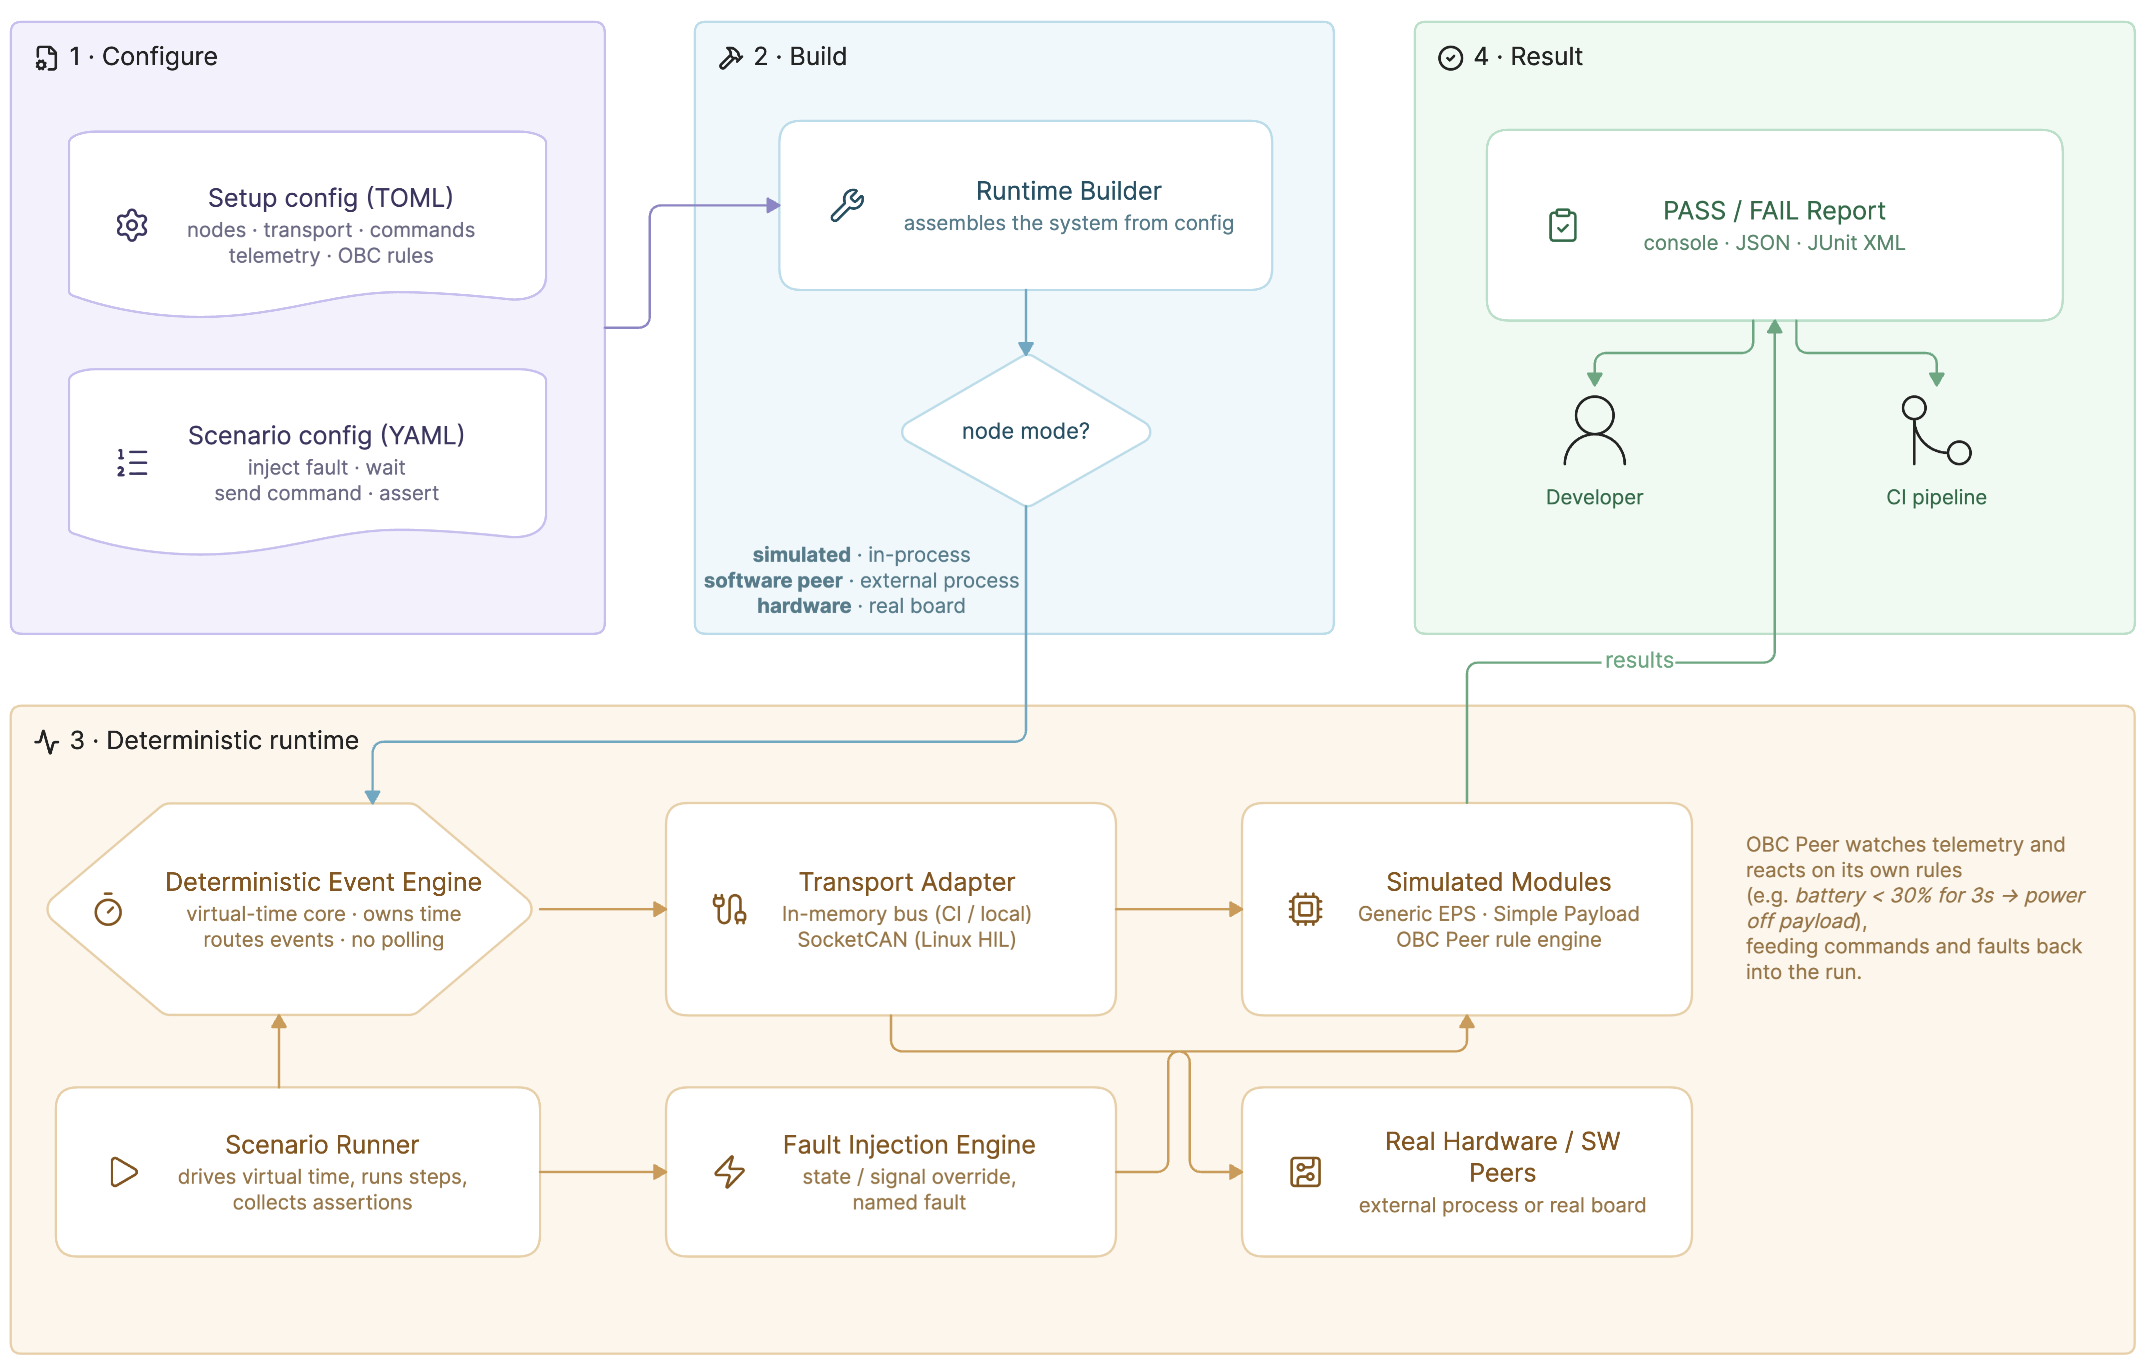
Status: v1.0.0 released and published to PyPI. See
CHANGELOG.md for what shipped and
docs/roadmap.md for what's next.
The framework is built around a Device Under Test (DUT) concept: any subsystem (OBC, EPS, ADCS, payload, ...) can be connected as real hardware, while every other subsystem it talks to is replaced by a configurable software peer. Switching which node is real and which is simulated is a config change, not a code change.
- Commercial subsystem simulators are proprietary and tied to specific hardware.
- Full mission simulators are often too heavy for focused subsystem verification.
- Hardcoded stubs inside flight code do not exercise the real bus and do not produce scenario-level PASS/FAIL results.
- Universal engine, not universal subsystem models. No single "generic EPS" can faithfully stand in for every real EPS board. The universal part is the engine: DUT/peer selection, protocol and transport adapters, deterministic scenario execution, fault injection and assertions. Concrete subsystem behavior lives in modules.
- DUT + switchable node modes. Every node is
simulated(a module insidecubesat_testbedemulates the subsystem),software(an external implementation runs as a peer), orhardware(a real board through a bus adapter). - Deterministic scenarios with PASS/FAIL reports. Scenarios are declarative YAML scripts: inject a fault, wait in virtual time, send a command, assert telemetry. The runner is built on virtual time and produces a PASS/FAIL report per assertion.
See docs/architecture.md for the full layer
breakdown.
pip install cubesat-testbed
cubesat-testbed run --example default
PASS t=4000000 assert_3: payload.telemetry.power_status == 'offline'; actual='offline'
SUMMARY scenario='EPS Low Battery Protection Test' assertions=1 passed=1 failed=0 started_at=0 finished_at=4000000
The examples ship inside the package, so that is the whole install. To get an editable copy of one to work from:
cubesat-testbed init my-testbed
cd my-testbed
cubesat-testbed run --config setup.toml --scenario scenario.yaml
init writes a setup.toml, a scenario.yaml and a README.md explaining
them, and refuses to overwrite existing files unless you pass --force.
cubesat-testbed init --list shows what else is available:
default        in-memory three-node satellite; OBC sheds the payload on a low battery
socketcan-hil  the same run against a real bus: payload as hardware on SocketCAN vcan0
module-params  retuning a built-in module through [nodes.<node>.params]
Working on the testbed itself instead of with it? See
CONTRIBUTING.md — the development flow is uv sync --extra dev from a clone, and uv run cubesat-testbed ... for every command below.
Same run as Quickstart above, but step by step — what each config field means and
how to read the result. Run cubesat-testbed init my-testbed first, so the two
files being taken apart here are in front of you.
1. The CubeSat setup (setup.toml)
Three nodes:
[nodes.obc]
mode = "simulated"
module_type = "obc_peer"
address = 1

[nodes.eps]
mode = "simulated"
module_type = "generic_eps"
address = 2

[nodes.payload]
mode = "simulated"
module_type = "simple_payload"
address = 3
mode = "simulated"— this node runs entirely inside the testbed. Switch to"hardware"later to point the same setup at a real board over SocketCAN — no code changes.address— the node's CSP address on the bus.
The behavior under test lives here:
[nodes.eps.telemetry.battery_percent]
offset = 0
length = 4
type = "float"
...

[nodes.obc.rules.low_battery_shed_payload]
signal = "eps.telemetry.battery_percent"
op = "<"
threshold = 30.0
for = "3s"

[[nodes.obc.rules.low_battery_shed_payload.actions]]
type = "send_command"
command = "payload_power_off"
EPS reports battery_percent as a 4-byte float, encoded onto the bus like a real
telemetry frame, not just held in memory. OBC has one rule: if battery stays below
30% for 3 virtual seconds, send payload_power_off.
2. The scenario (scenario.yaml)
steps:
  - action: "inject_fault"
    type: "state_override"
    target: "eps.model.battery_percent"
    value: 25
    duration: "5s"

  - action: "wait"
    virtual_time: "3s"

  - action: "assert"
    signal: "payload.telemetry.power_status"
    op: "=="
    value: "offline"
timeout: "1s"inject_fault— force EPS's battery to 25% for 5 virtual seconds (bypasses the discharge model to test the reaction, not the physics).wait— advance virtual time 3s, giving the rule'sfor = "3s"window a chance to elapse.assert— checkpayload.telemetry.power_status == "offline", retried against incoming telemetry for up to 1s.
3. Run it
cubesat-testbed run --config setup.toml --scenario scenario.yamlPASS t=4000000 assert_3: payload.telemetry.power_status == 'offline'; actual='offline'
SUMMARY scenario='EPS Low Battery Protection Test' assertions=1 passed=1 failed=0 started_at=0 finished_at=4000000
4. Reading it
t=4000000— virtual microseconds (4s), not 3,000,000: telemetry is only re-encoded once per physical step, so the earliest honest chance to see "offline" is the beacon after the command actually lands. That one-step delay is expected, not a bug.assert_3— auto-generated name (3rd, unnamed step); addname:to a step for a readable label.passed=1 failed=0and exit code0— wire straight into CI.
5. When it fails
Drop the inject_fault step from scenario.yaml (battery never actually
drops) and rerun:
FAIL t=4000000 assert_2: payload.telemetry.power_status == 'offline'; actual='online'
Exit code 1. actual='online' is the real, decoded-from-the-bus value — not a
guess.
6. Machine-readable output
cubesat-testbed run --config ... --scenario ... --json --quiet{
"scenario": "EPS Low Battery Protection Test",
"passed": true,
"exit_code": 0,
"assertions": {
"total": 1, "passed": 1, "failed": 0,
"results": [{
"name": "assert_3",
"signal": "payload.telemetry.power_status",
"expected": "offline", "actual": "offline",
"passed": true, "evaluated_at": 4000000
}]
}
}Or --junit-xml PATH for CI dashboards. Full config syntax:
configs/schema/module_schema.md.
7. Seeing the actual bus
Add --trace for a decoded frame-by-frame trace on stderr:
trace t=4000000 TX can_id=0x10004103 dlc=8 pri=2 src=2 dst=2 dport=20 sport=20 flags=0x00 data=0009450041c80000 payload=41c80000 telemetry eps.telemetry.battery_percent=25.0
trace t=4000000 TX can_id=0x10006083 dlc=5 pri=2 src=1 dst=3 dport=10 sport=10 flags=0x00 data=0004a28000 payload=00 command obc.payload_power_off->payload
Virtual timestamp, direction, CSP v2 header fields, the raw bytes as candump
would show them, and the command route or telemetry value decoded out of the
frame. This is the same decode path assertions use — the trace is a window on
it, not a parallel report. It goes to stderr, so it composes with --json
and --quiet, and it works on SocketCAN too, where it is the only way to see
what your testbed actually put on the wire.
Point the same scenario at a real bus: switch the node under test to
mode = "hardware", declare a SocketCAN transport, and run with --realtime.
[transport]
type = "socketcan"
interface = "vcan0" # or a physical interface such as "can0"
That is exactly what the socketcan-hil example does to the setup above —
one node's mode, one transport block, no code change:
cubesat-testbed init hil --example socketcan-hil
cubesat-testbed run --realtime --config hil/setup.toml --scenario hil/scenario.yaml
--realtime is what makes a HIL run work: without it the engine jumps
straight through virtual time and a real board never gets wall-clock time to
answer. A socketcan setup run without the flag therefore warns on stderr.
Under --realtime, a scenario that waits 30s really does take 30 seconds.
Add --trace when a HIL run misbehaves: on SocketCAN the adapter never
receives its own messages, so the trace is the only place both what the
testbed sent and what the board answered show up side by side.
For local loopback without hardware, bring up vcan0 first:
sudo modprobe vcan
sudo ip link add dev vcan0 type vcan
sudo ip link set up vcan0- Protocol: CSP v2 only, single-frame, classic CAN 2.0, extended 29-bit IDs.
- Modules: Generic EPS, OBC Peer (rule engine), Simple Payload.
- Transports: in-memory (CI/tests) and SocketCAN (Linux HIL).
- Deterministic virtual-time engine, TOML setup + YAML scenarios, PASS/FAIL
CLI report with CI-friendly exit codes, JUnit XML output and a decoded
wire-level frame trace (
--trace).
Full detail, constraints, and what's deliberately out of scope for v1:
docs/v1-scope.md.
- Architecture
- Product v1 scope
- Config schema reference
- CSP golden vectors
- Roadmap
- Contributing
- Changelog
Python >=3.11, Pydantic, PyYAML, python-can, uv for dependency/environment
management, pytest + ruff + mypy for development.
Apache License 2.0. See LICENSE.