

FP&A Analyst | Budgeting · Forecasting · Variance Analysis | Excel · Power BI · SQL
FP&A Analyst with hands-on experience building financial models, variance analyses, and management reports that drive real business decisions — across multi-location retail and eCommerce operations. Skilled in Excel (Power Query, Power Pivot, DAX, VBA), SQL, and Power BI to build budgeting frameworks, model contribution margins, and deliver executive-level financial insights.
- SQL (PostgreSQL): Joins, CTEs, aggregations, window functions
- Excel: Power Query, Power Pivot, DAX, VBA, financial modeling, scenario analysis, dashboard development
- Power BI: Dashboard development, DAX measures, data modeling
- FP&A: Budgeting & forecasting, variance analysis, contribution margin analysis, P&L reporting, KPI reporting
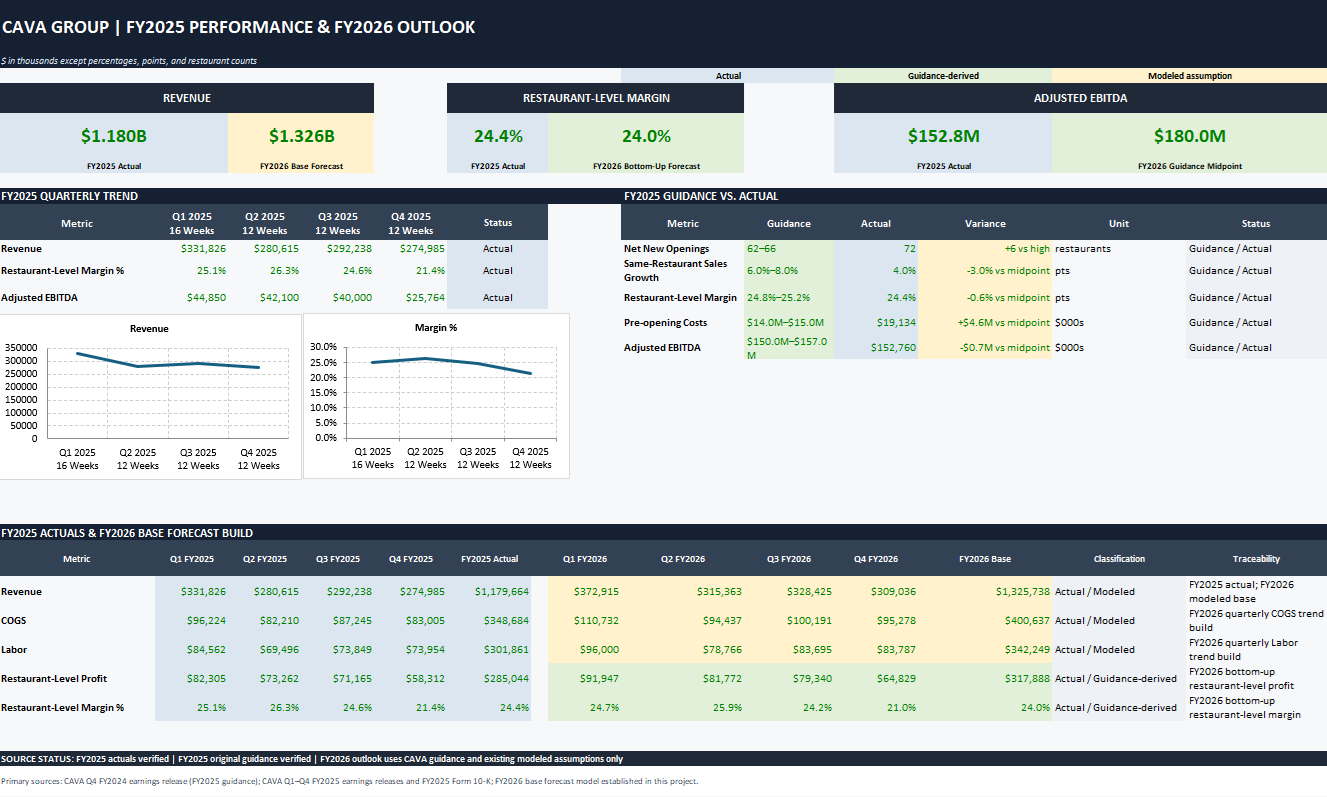
Excel forecast model reconstructing FY2025 performance from public filings and building a Low/Base/High FY2026 outlook. CAVA missed same-restaurant sales guidance by up to 4 points, but unit growth (72 openings vs. 62-66 guided) offset enough of the shortfall to land Adjusted EBITDA within the original guidance range.
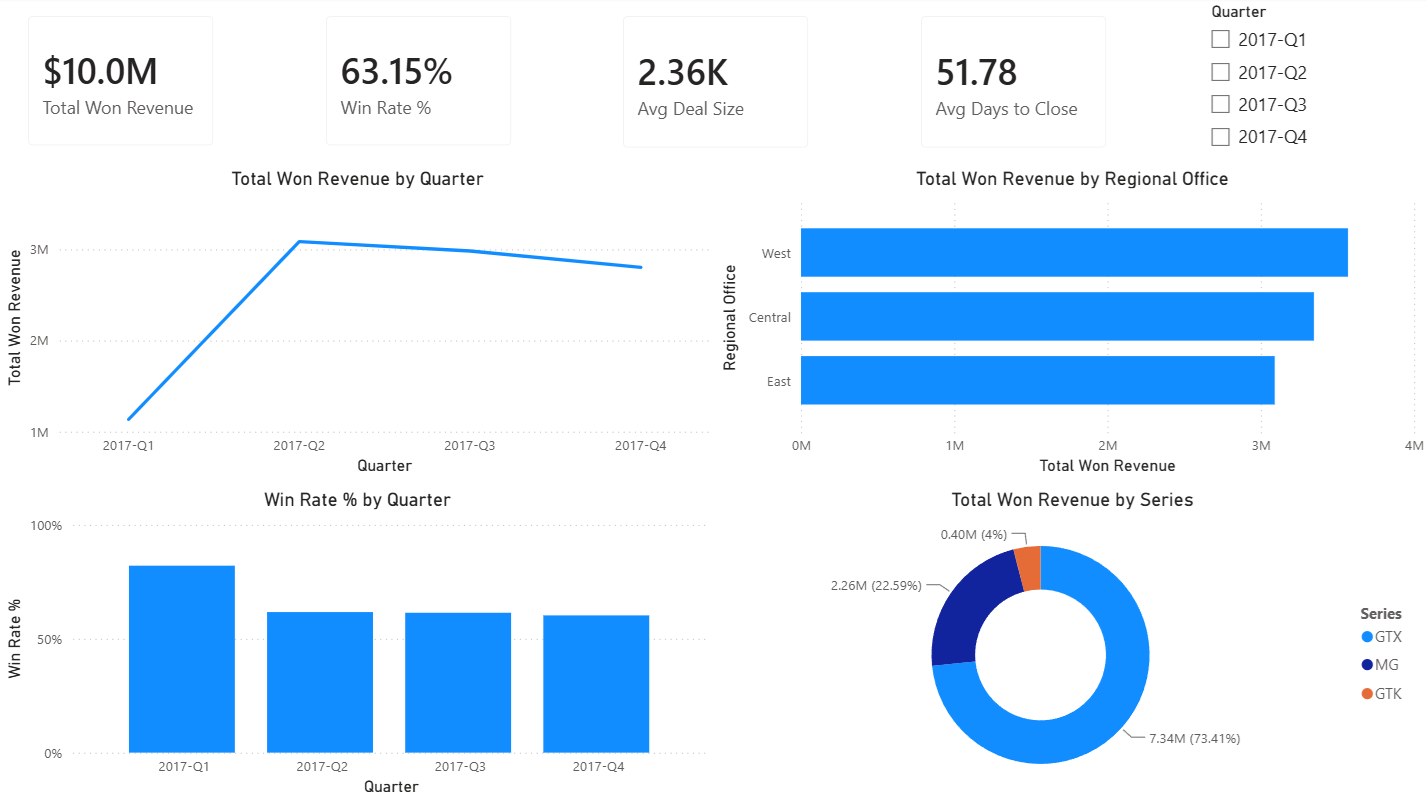
Excel and Power BI dashboard simulating a quarterly FP&A business review — $10.0M in won revenue, budget-vs-actual quota attainment, and pipeline coverage analysis. Built with Power Query, Power Pivot, DAX, and a tiered commission accelerator model.
SQL analysis (PostgreSQL, CTEs, window functions) of ecommerce sales, discounting, and product mix — the top 5 product variants drove over 98% of net sales, exposing significant revenue concentration risk.
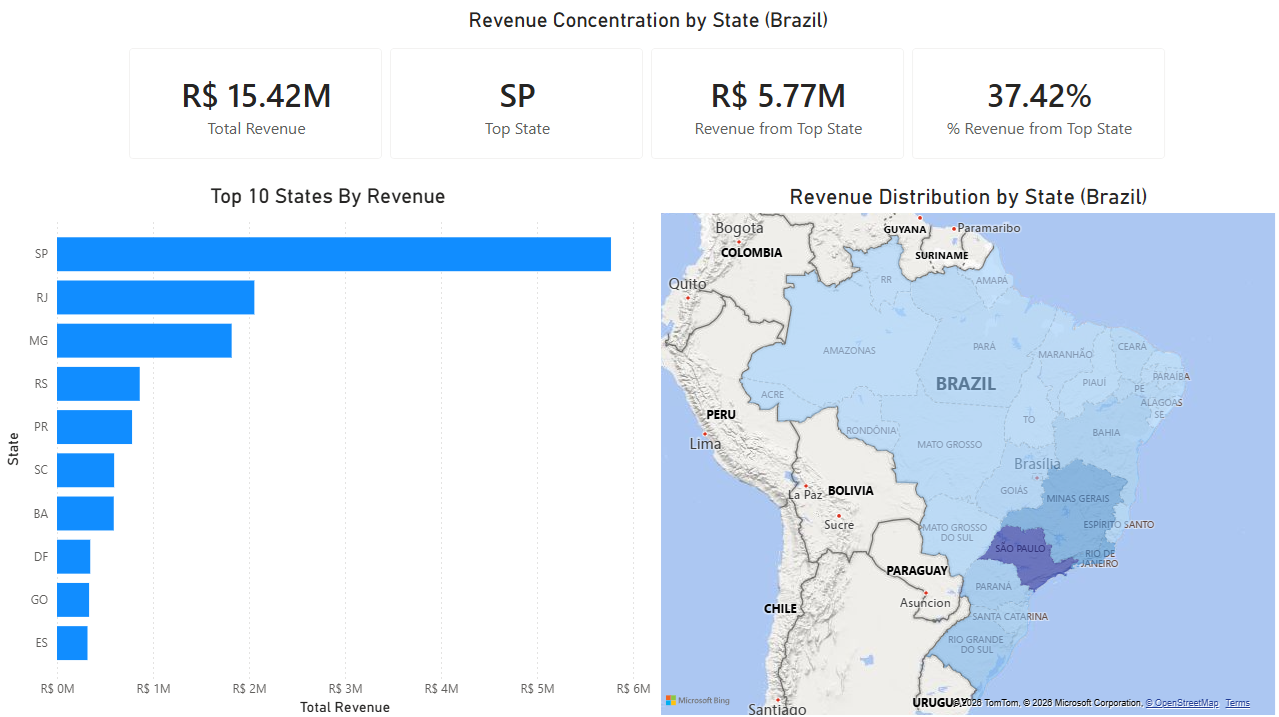
Power BI revenue dashboard analyzing $15.4M in orders — revenue mix, customer retention trends, and geographic concentration using SQL and DAX. São Paulo accounted for 37.4% of total revenue.
- iFood — Marketing Campaign Performance — Excel dashboard analyzing campaign ROI across 2,021 customers; acceptors spent 2x more than non-acceptors.
- Hospital Readmissions SQL Analysis — SQL analysis of 130 U.S. hospitals (1999–2008) covering lab procedures, length of stay, and 30-day readmission rates.
- IBM HR Attrition Analysis — R analysis of employee attrition using correlation, visualization, statistical testing, and regression modeling.
- NBA Player Performance Analysis — Tableau dashboard analyzing points, assists, and rebounds across 30 teams and 500+ players.
- Massachusetts Education Analysis — Tableau dashboard covering 1,861 schools and 953,748 students, exploring graduation rates and class size vs. college admission rates.
- Flotation Plant Python Analysis — Python analysis of 737,453 rows of industrial sensor data exploring iron ore separation efficiency.
- Python for FP&A automation (pandas, openpyxl, financial modeling)
- Advanced Excel: scenario modeling, sensitivity analysis, rolling forecasts