




mapflow creates geographic plots and video animations directly from
xarray.DataArray objects. It detects common
coordinate names, understands CRS metadata, includes world borders, and streams lazily backed animation frames to
keep memory use bounded.
Install the Python package from PyPI:
python -m pip install mapflowOr from conda-forge, which also installs FFmpeg:
conda install -c conda-forge mapflowCreating animations requires the ffmpeg executable on PATH. Static plots do not require FFmpeg.
import xarray as xr

from mapflow import animate, plot_da

ds = xr.tutorial.open_dataset("era5-2mt-2019-03-uk.grib")
temperature = ds["t2m"]

plot_da(temperature.isel(time=0))
animate(temperature.isel(time=slice(120)), "temperature.mp4", video_width=1280)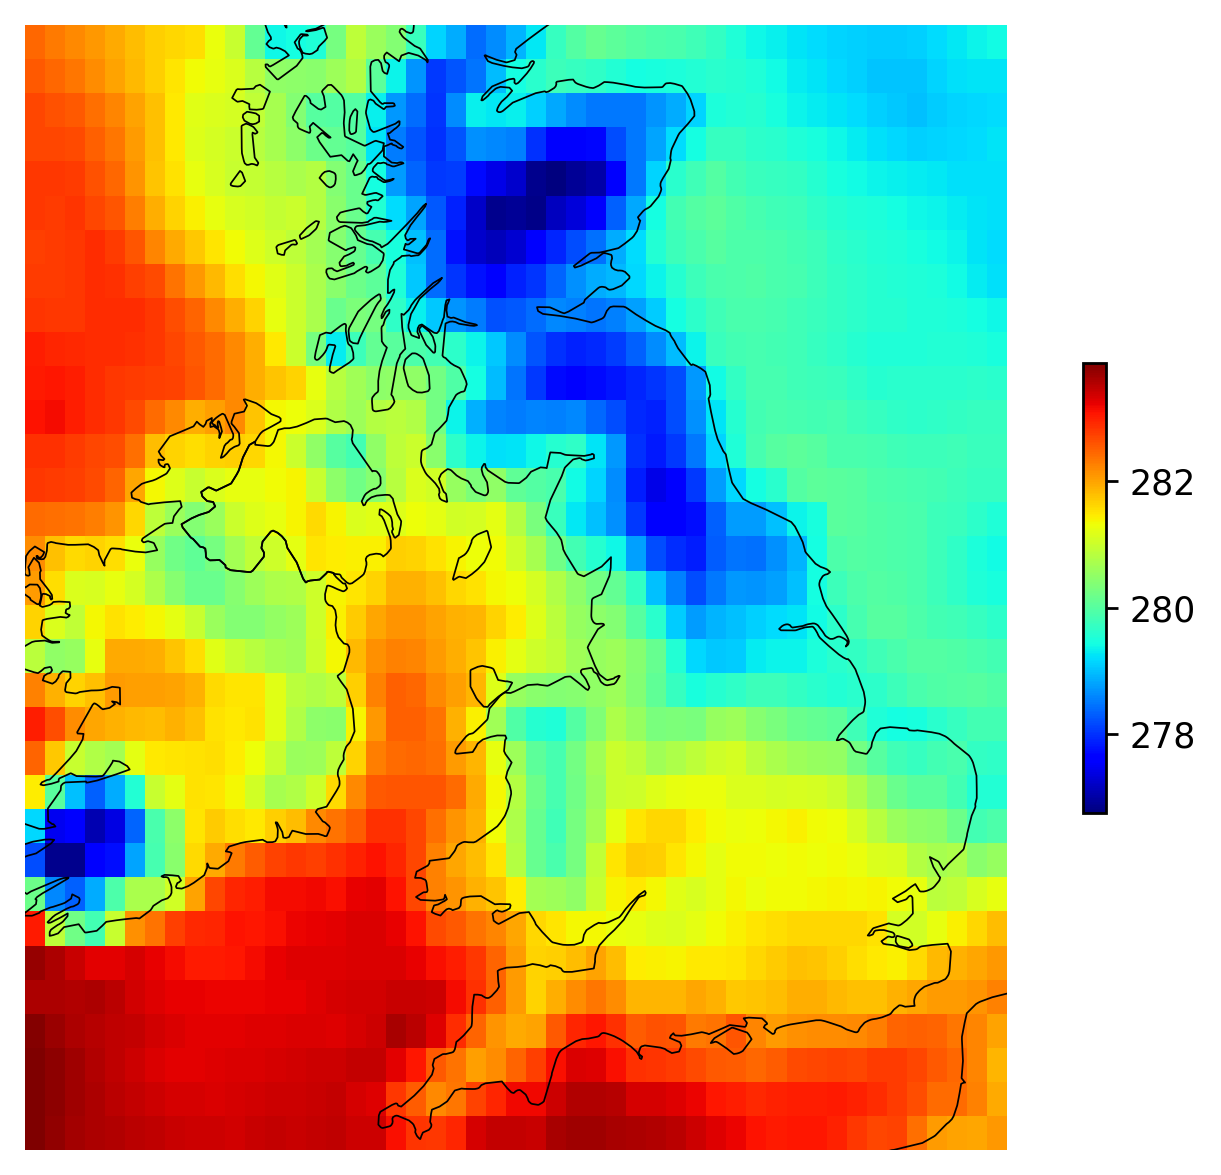
The documentation covers static plots, scalar animations, vector-field quiver
plots, CRS handling, color normalization, and the reusable PlotModel and Animation classes.
git clone https://github.com/CyrilJl/mapflow.git
cd mapflow
uv sync --group dev
uv run pytest
uv run ruff check .
uv run ruff format --check .
See CONTRIBUTING.md for the full contribution and release checks. Changes are documented in CHANGELOG.md.
Licensed under the Apache License 2.0.